Arduino based Electricity monitor
Jon Archer
- 4 minutes read - 840 wordsOver the past 12 months or so I’ve been looking to add various “Smart House” components to my home, rather than do this in the traditional sense of buying something off-the-shelf I’ve been experimenting and building my own. One of the real plus points in me doing this is that all the data that is passed around is in an open standard and format chosen by me, not some cludge to try and extract information in a format decided by a-n-other manufacturer.
This post will cover the process I’ve gone through to build an Arduino based energy monitor, in the first instance this is only monitoring electricity usage
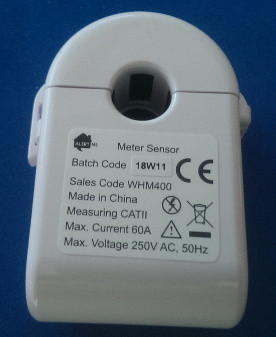
First step was to look at what information I could glean from the meter itself, there are a number of ways to extract information here, a clamp which sits around the wire between the meter and the consumer unit:
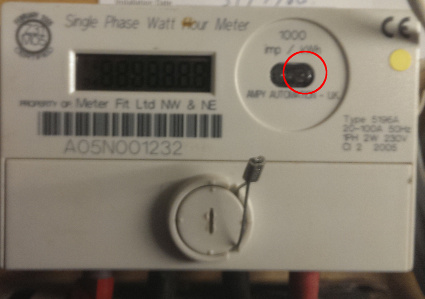
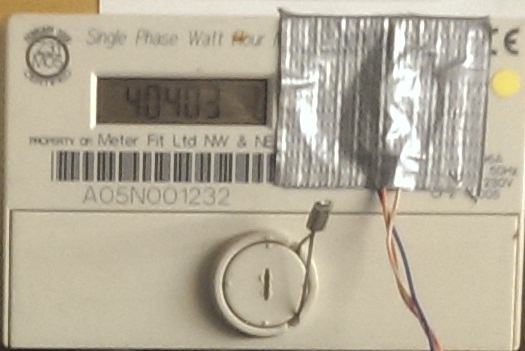
The other ways generally involve retrieving a pulse of some kind from the meter, either via a screw in terminal which sends a pulse over wire or a flashing LED. In my case it was a flashing LED as you can see in the following image.
This LED sends out a pulse every time a watt is used, or for monetary conversion 1000 for every kilowatt used. So knowing this I could create a device to read these flashes and convert them into usable data.
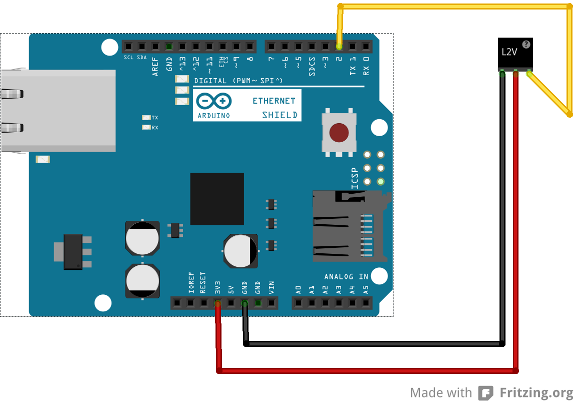
The configuration of the above circuit is really simple, a TSL261 Light to Voltage sensor connected to an arduino with an ethernet shield.
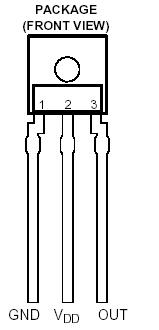
How to connect the TSL261 looking at the component, the sensor will have a raised part above it, this is the front. Front the front the pins run from left to right, pin 1 being GND, pin 2 V+ and pin 3 output. In my circuit I connected the voltage and ground appropriately (3v) and attached the output to digital pin 2.
My current incarnation has pins soldered to one end of a length of wire and the sensor the other (I used strands from CAT5e cable) to allow me to position the arduino then attach the sensor to the front of the electric meter, the attachment was a complicated process of sticking with some trusty old duct tape. I still need to get some heat shrink tubing to ensure the pins don’t short but it’s ok for now.
While researching this project I found this site, http://www.airsensor.co.uk/component/zoo/item/energy-monitor.html which took the data collected and stored it in a file on the SD card. This wasn’t exactly what I was looking for as I wanted to graph the data preferably from a live feed. I thought the best way to do this was to utilise one of my favourite current tools which I use in a lot of my other projects MQTT, I wanted the arduino to simple detect a pulse and send out information which I could retrieve on any device subscribed to a particular topic. More research led me to a page Nicegear where I found Hadley Rich doing pretty much exactly what I was looking for, his Arduino sketch created an output on a particular MQTT topic when a pulse was detected, but to top this he had also created a function to output the current watt usage every second. This proved to be more useful than the original idea of outputting the pulse on detection.
You can find the sketch at Hadleys website, or on my GitHub page. The only real difference between his sketch and the one on my arduino is the count of LED flashes per kWh, his needs to flash 1600 per kWh mine flashes 1000, or 1watt per flash.
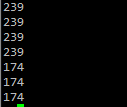
So subscribing to the topic house/power/meter/1/current would recieve a number of watts currently being used
or topic house/power/meter/1/usage would output a 1 everytime a pulse occurred.
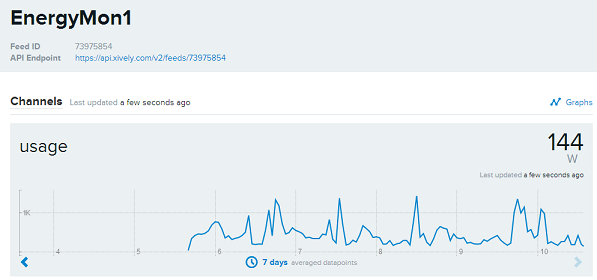
Now what to do with this data? My plan was to graph the data so had to figure some way of getting this data into a graphing application or service. More research ensued, Graphite/Carbon seems to be an ideal choice to pursue but at this point in time haven’t got anything functional. A lot of posts around the internet suggest the use of pachube, which became cosm which then became xively. Using a python script to listen to the mqtt topic usage and pipe to the xively API I ended up with a nice graph.
You can see my live feed here, xively.com/feeds/73975854
All in all, I’m really pleased with this project. It’s still rough around the edges in places, both physically and software wise. I’d like to move the project to an Arduino mini pro with one of the smaller ethernet shields and have a nice box to house it. Get a graphite instance working and retrieving the data. First on the next steps list however is to try and extract the same information from the gas meter, I believe there is a pulse output on the front of the meter but this will require some more research so watch this space.
